JSA Annual Crime Report 2020
The total dollar losses from crimes against U.S. jewelry firms decreased from $101.0 million in 2019 to $83.2 million in 2020, a decrease of 17.6%.
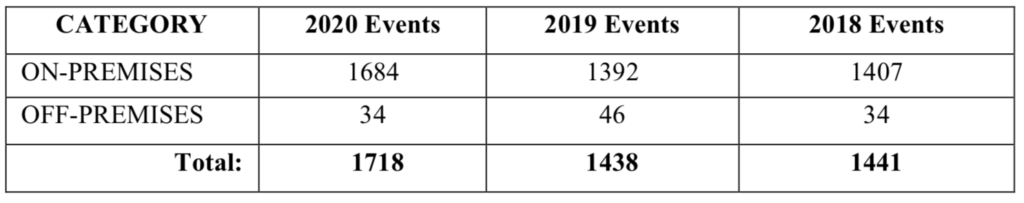
The total number of crimes committed against U.S. jewelry firms increased from 1,438 in 2019 to 1,718 in 2020, an increase of 19.5%.
The number of on-premises burglaries increased from 327 in 2019 to 633 in 2020, an increase of 93.6%. In 2020 JSA received reports of 323 burglary incidents involving the looting and civil unrest from May to August totaling $14.3 million. There was also a great deal of property damage not included in that total.
Smash and Grab robberies declined from 130 in 2019 to 96 in 2020. The decline is credited to the work of the FBI and local law enforcement agencies that arrested a major smash and grab robbery crew.
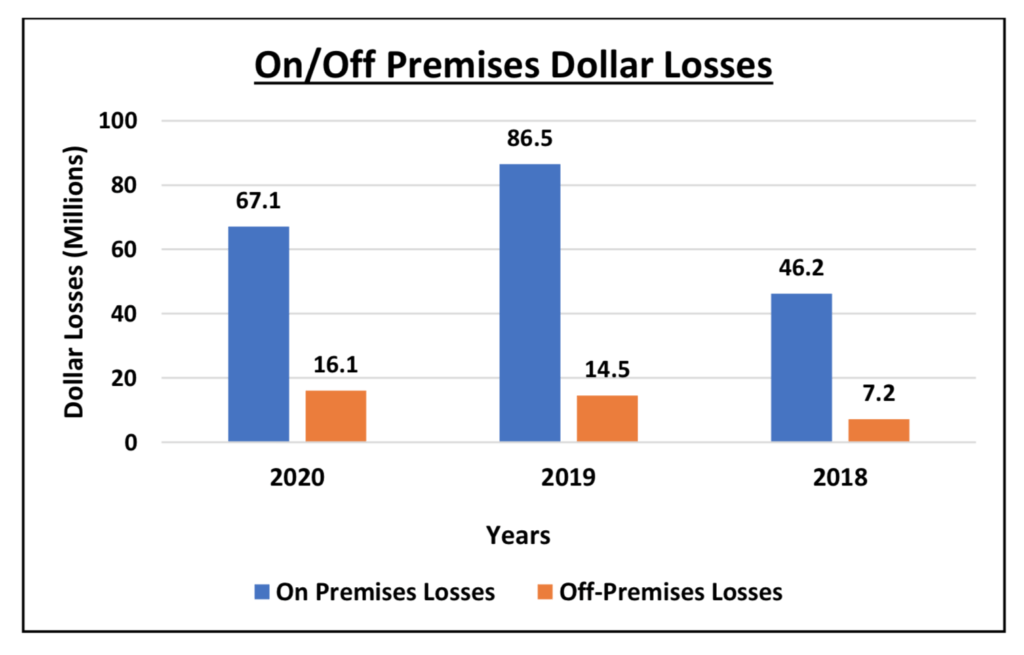
The total dollar losses of off-premises crimes increased from $14.5 million in 2019 to $16.1 million in 2020. In 2019 JSA received only one report of an off-premises crime of over $1 million, compared to five in 2020 with losses of over $1 million each.
Combined On/Off-Premises Losses and Events
From 2019 to 2020, dollar losses decreased by 17.6%, and the total number of criminal events increased by 19.5%.
On-Premises Crime
This section provides statistical data regarding criminal activity that targets jewelry locations as opposed to couriers, traveling salespersons, or retailers away from their stores. For example, this section includes a robbery, burglary or theft committed at a retail jewelry store, at the plant of a jewelry manufacturer or the office of a wholesaler.
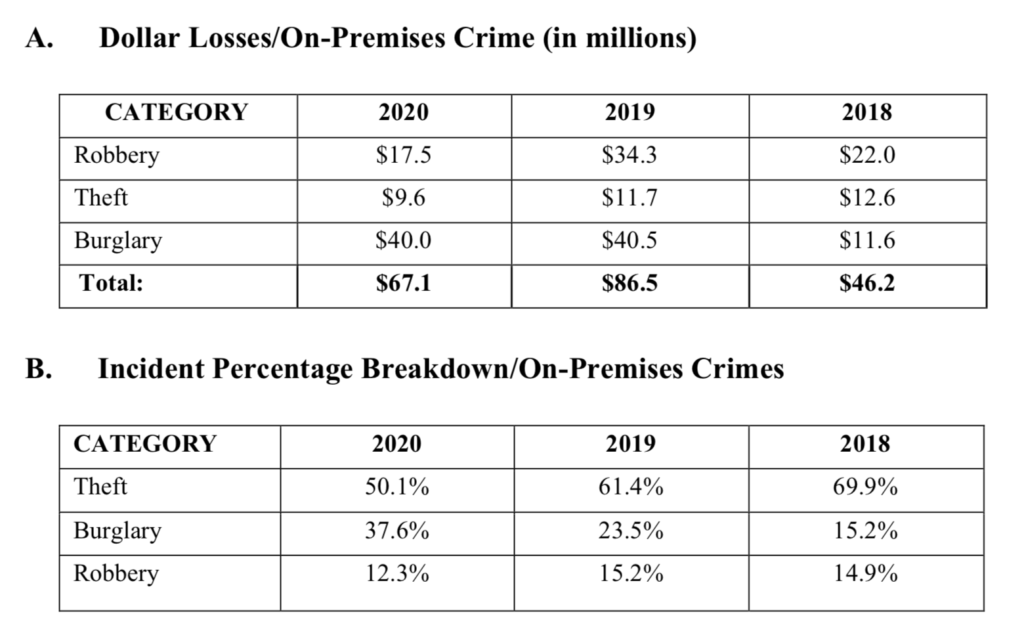
Available data regarding all on-premises crime categories indicates an 22.4% decrease in dollar losses, and a 21.0% increase in criminal events in 2020 compared to 2019. In 2020 the JSA generated 1,684 on-premises crime reports from multiple reporting sources compared to 1,392 reports in 2019.
Robberies
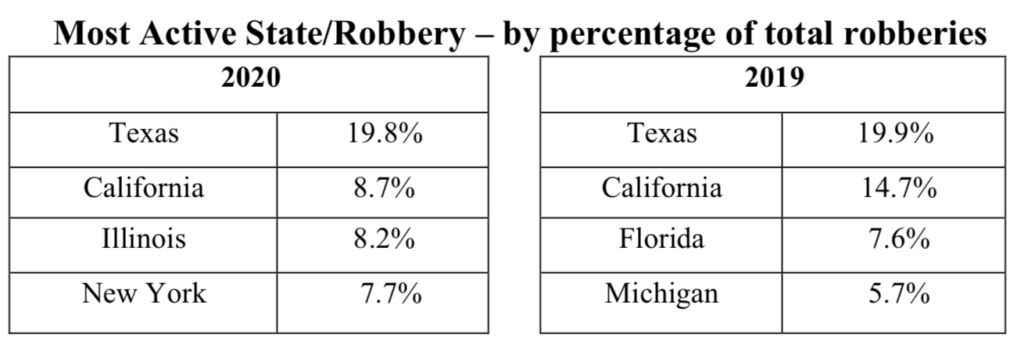
The number of robberies in 2020 decreased by 1.9% from 2019. There were 207 robberies reported to JSA in 2020 compared to 211 in 2019. The number of Smash & Grab robberies decreased from 130 in 2019 to 96 in 2020, which is a 26.2% decrease. JSA has seen a 50.0% decrease in the use of a gun during the commission of a Smash & Grab, 20 in 2019 compared to 10 in 2020. In 2020 there were 58 arrests of suspects in Smash & Grab cases compared to 79 arrests in 2019. Robbery dollar losses decreased by 49.0% in 2020 compared to 2019. Losses for 2020 were $17.5 million compared to $34.3 million for 2019. On-Premises robberies occurred in 37 States: 44.4% of jewelry industry on-premises robberies were committed in just four states.
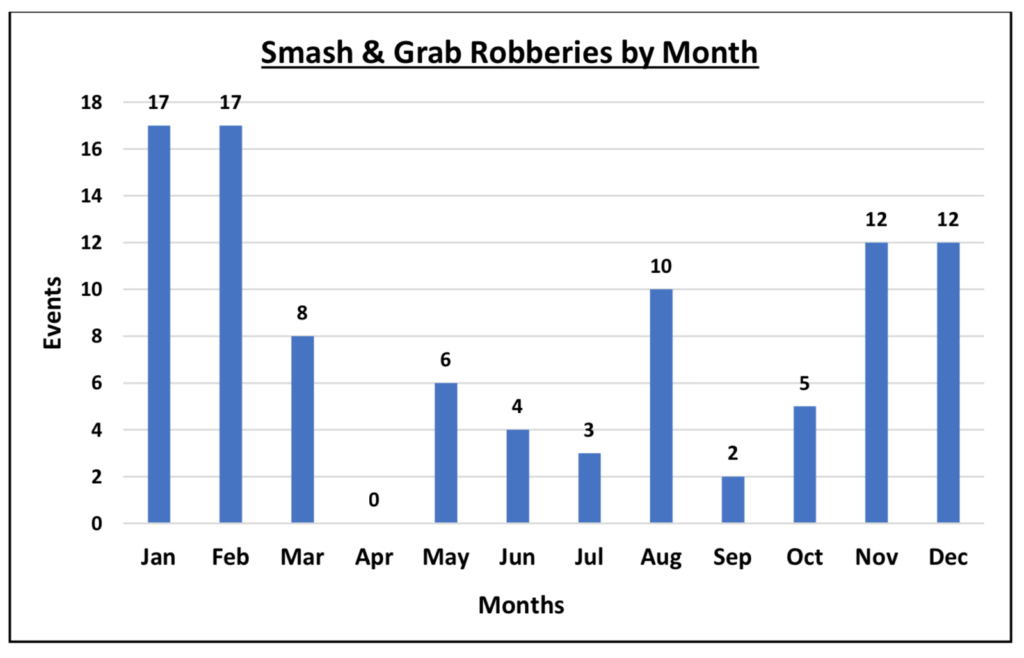
The most active month for robberies is January with 33 (15.9% of total robbery events). The least active is April with 2 (1.0% of total robbery events). The average number of robberies per month is 17.3.
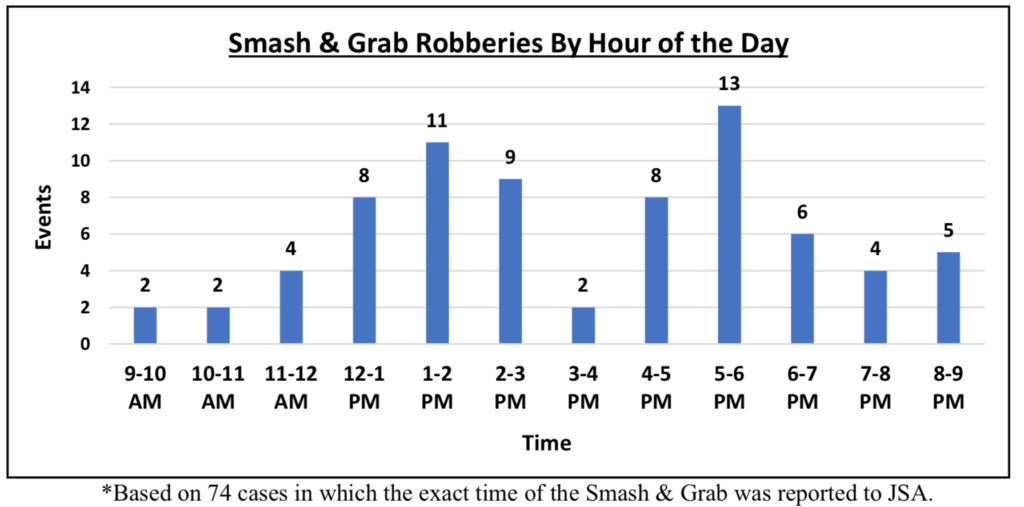
In 2020 the greatest number of robberies occurred between 1:00 p.m. and 2:00 p.m. with 20. The second most active time was between 5:00 p.m. and 6:00 p.m., with 17. There was no 60-minute period during a normal workday when robberies did not occur.
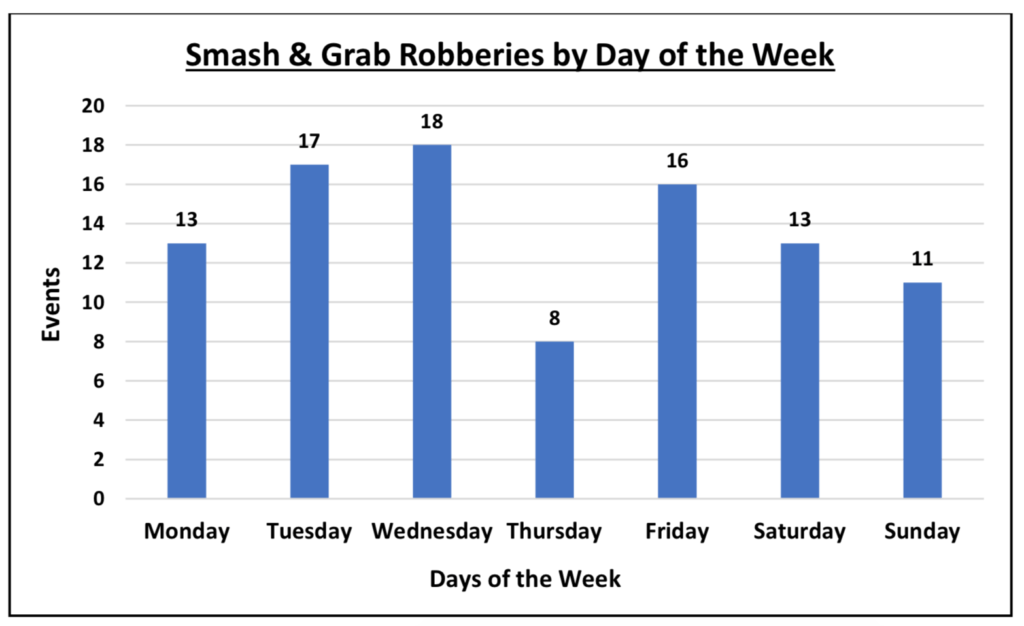
As reported in previous years, robbery events occurred with similar frequency on weekdays and with less frequency on weekends. Wednesday was the most active day during 2020. Sunday was the least likely day for a robbery to occur.
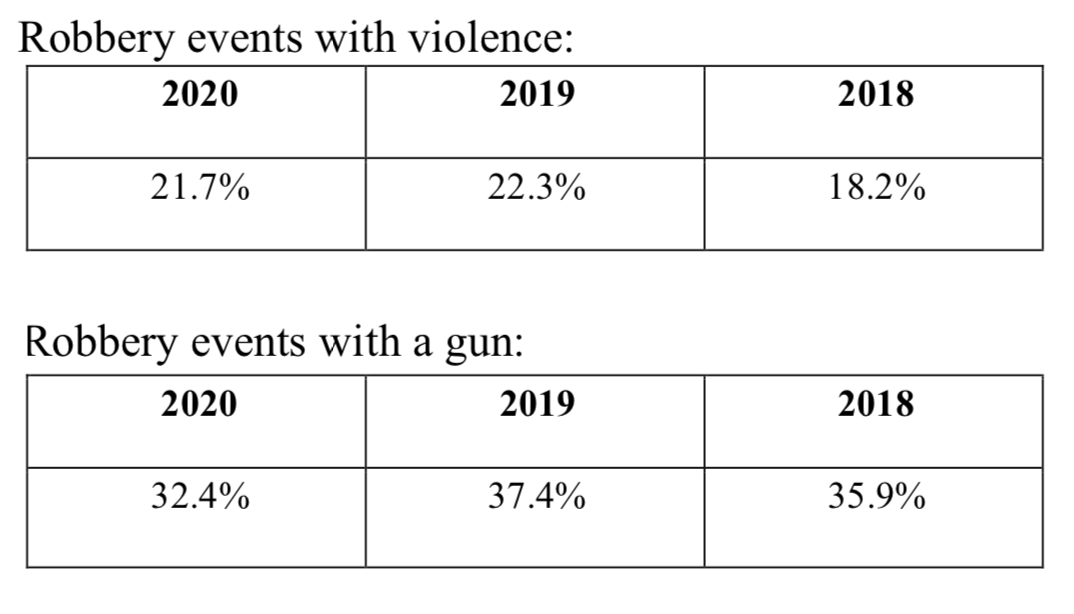
In 2020 there was a decrease in both the percentage of robberies in which robbers displayed a gun, and in violence during robberies compared to 2019.
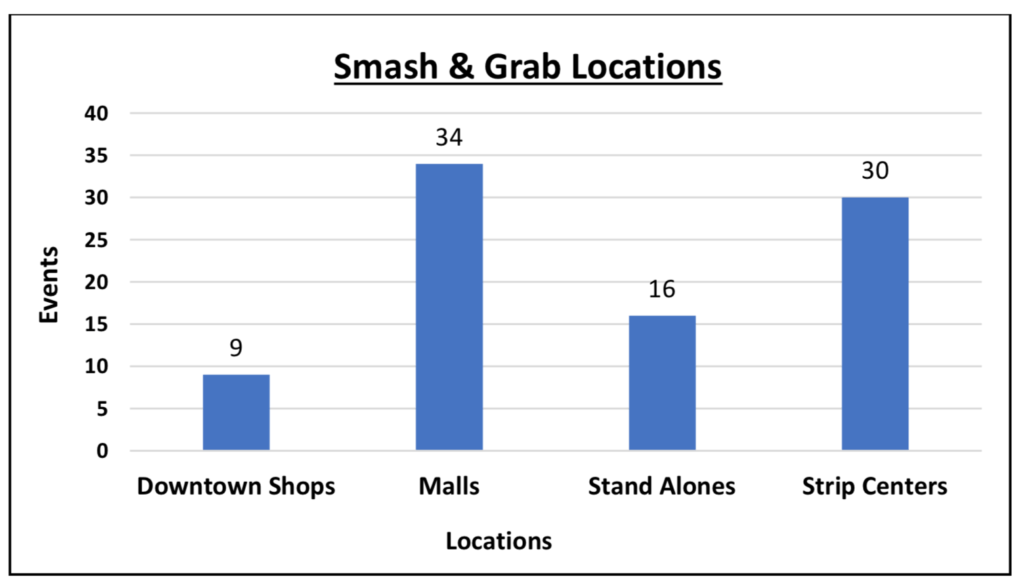
Smash & Grab Robberies
In 2020, jewelry stores in malls experienced the most Smash & Grabs.
Homicides
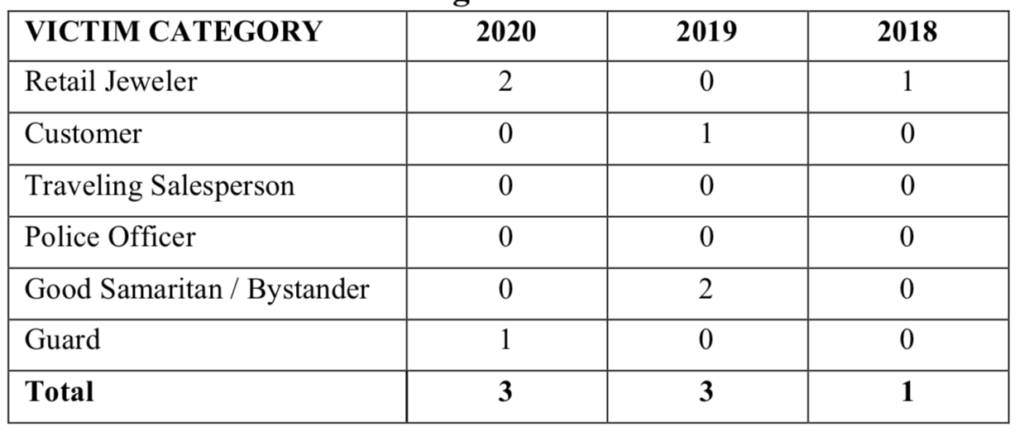
In 2020, two retail jewelers and one guard were killed during jewelry robberies.
In 2020, two robbers were killed during the commission of a robbery, while in 2019, three robbers were killed during the commission of a robbery.
The frequency of incidents of shots fired in jewelry robberies when no one was hit was 6 separate incidents in 2020, which was two more than the amount in 2019.
Burglary Losses: $40 Million in 47 States
Dollar Losses Flat, Events Dramatically Increased
Losses were $40.5 million in 2019 compared to $40.0 million in 2020, which is a 1.2% decrease in dollar losses. As a result of the civil disturbances in May and June, burglaries increased dramatically, to 633 in 2020 compared to 327 in 2019, a 93.6% increase.
Safe Attacks
The frequency of safe attacks decreased from 44 in 2019 to 35 in 2020 which was a 20.5% decrease. Safe attacks occurred in 17 states in 2020 and represented 5.5% of the total number of burglaries against the jewelry industry. In 2020 California and Georgia were the most active states for safe attacks and the average loss for a burglary that involved a safe attack was $287K. In 2019, the average loss for a burglary that involved a safe attack was $491K. In 2020 there were 3 safe attack burglaries in which the loss amount was at least $1 million. In 2019 there were 7 safe attack burglaries in which the loss amount exceeded $1 million.
Three-Minute Burglaries (B3M) $4.1 Million Losses in 33 States
These occurrences are identified as “Three Minute Burglaries” because that is the approximate time required to complete this crime. They are usually committed in the middle of the night by smashing a glass front door or window of a retail establishment, and then smashing display cases and stealing out-of-safe merchandise.
The B3M category represents approximately 17.5% of the total number of burglaries experienced by the jewelry industry. Out of 633 burglaries reported in 2020, 111 were B3M compared to 148 in 2019, a decrease of 25.0%. The average B3M in 2020 resulted in a loss of approximately $28K in jewelry, compared to $27K in 2019. In addition, B3Ms cause property damage, business interruption and possible negative customer reaction.
Most Frequent Points of Entry for All Burglaries
During high-tech burglaries that involve a safe or vault attack, entry is often gained by cutting a hole in the roof or an adjacent unprotected wall or ceiling after an alarm and/or electrical system has been compromised in some manner.
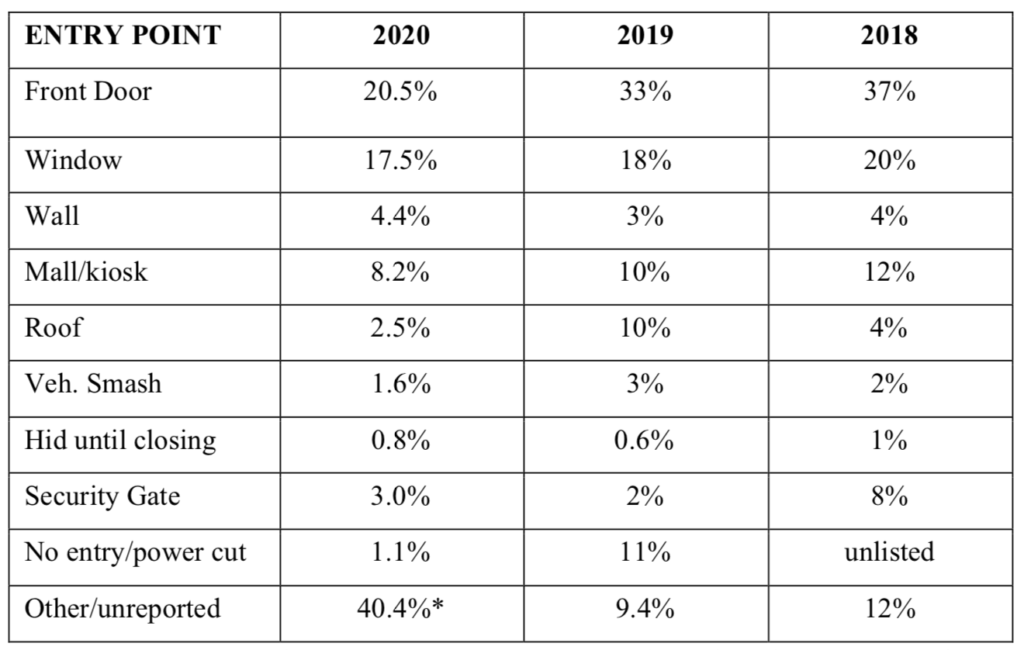
Between May 25, 2020, and August 31, 2020, 323 out of 633 burglaries reported to JSA were recorded as looting and civil unrest burglaries. In 193 civil unrest burglaries, the exact entry point was unspecified, however, subjects typically gained entry through jewelry stores’ front entrances.
Rooftop Burglaries
JSA received reports of 16 rooftop burglaries from 11 states in 2020, compared to 34 rooftop burglaries from 15 states in 2019. In 2020, Florida was the most active state with 4 rooftop burglaries and California was the second most active state with 3. Several of these burglaries resulted in large losses. Alarm systems, often without line security, were compromised. In other cases when alarm signals were sent, responding police units, unable to detect any obvious evidence of a break-in during a cursory exterior inspection, and unable to conduct an internal search, left the scene while the burglars were possibly inside, on the roof or nearby. In 2020, law enforcement authorities and JSA tracked Chilean and Colombian gangs that conspired to commit these professional burglaries.
Theft: $9.6 Million in Losses in 844 Events in 2020 vs $11.7 Million in 854 Events in 2019
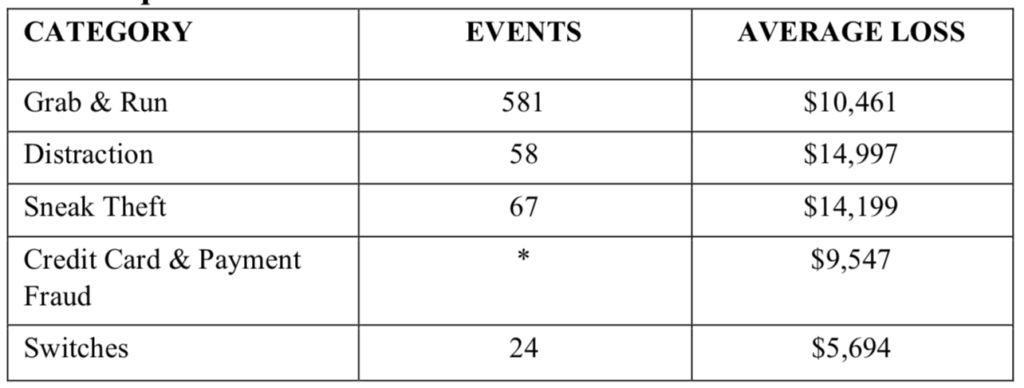
* Because they are often not reported nor covered by insurance, JSA does not receive comprehensive reporting of credit card fraud for statistically valid inclusion in this crime report.
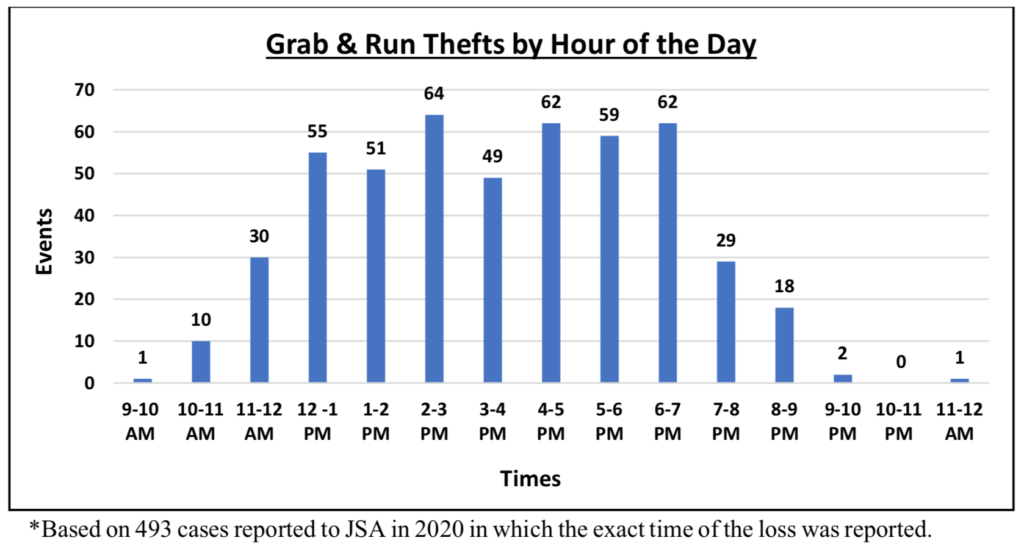
Grab & Run Losses Reported in 44 States
In 2020, there were 581 Grab & Run crimes recorded by the JSA, compared to 616 in 2019, a 5.7% decrease. 68.8% of all thefts reported to the JSA in 2020 were Grab & Run events. A Grab & Run can result in a significant dollar loss, and one Grab & Run in Tennessee resulted in a loss of $400,000 in jewelry merchandise.
Off-Premises Crime
This section provides statistical data regarding criminal attacks occurring away from the victim’s business base of operations. For example, attacks against traveling jewelry salespersons, trunk and remount show operators, couriers, firms exhibiting at jewelry shows, retailers attacked away from their place of business, including at home, and other industry members traveling with jewelry.
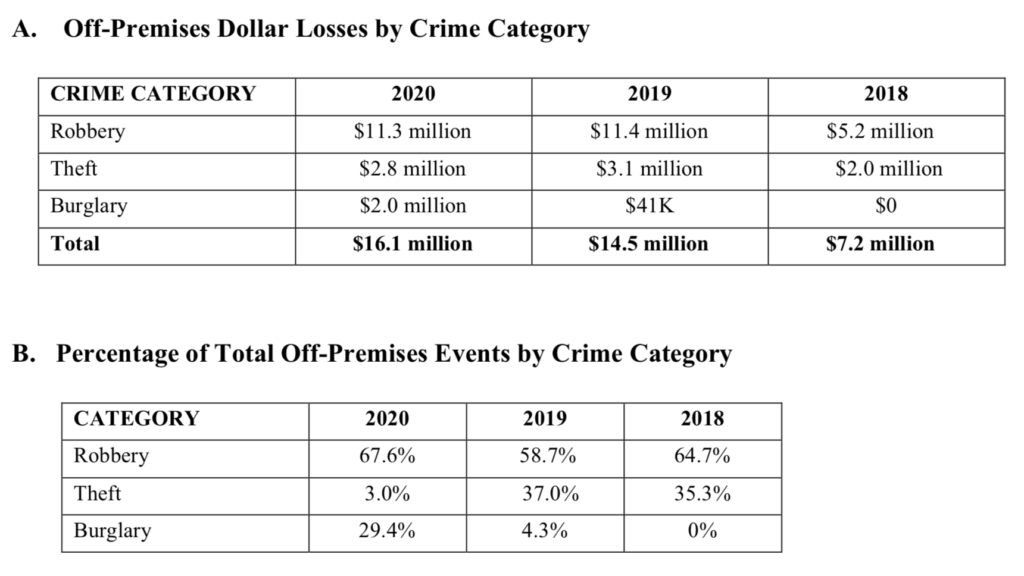
Off-Premises Losses: $16.1 Million in 8 States
Dollar losses increased 11.0% during 2020 and the number of criminal events decreased by 26.1%. This report compared 34 cases from 2020 to 46 cases reported to JSA in 2019. Off-Premises crimes were reported during all calendar months for 2020 except for April and May. February and October were the most prevalent months for off-premises crimes, with 6 in each month. In 2020, a total of 20 crimes involved a traveling salesman which was 58.8% of all off-premises crimes in 2020.
Off-Premises Robberies
There were 23 off-premises robberies reported to JSA in 2020, which is a 14.8% decrease from 2019. In 23.5% of all off-premises crimes (8 out of 34) reported to JSA in 2020, a victim was physically assaulted. A gun was displayed in 7 of the robberies and a knife or sharp object was displayed in 2 incidents. A jeweler was shot in 1 robbery and survived.
In 2020 the JSA received no reports regarding Trunk/Remount show losses.
Off-Premises Thefts
There were 10 off-premises thefts in 2020 with $2.8 million in losses. Five out of the 10 thefts were from unattended vehicles. Unless special insurance riders have been purchased, this type of loss is not generally covered by insurance.
In 2020, parking lots and highways/streets were tied for the most common crime scene for off-premises attacks, with 7 incidents each. In at least two crimes, salespeople were followed from jewelry trade shows and were later targeted at a restaurant parking lot and at their residential parking space.
Four states accounted for 88.3% of all off-premises losses in 2020: California (32.4%), Florida (32.4%), New York (17.6%), and New Jersey (5.9%).
In 1999 the U.S. diamond, jewelry and watch industry experienced 323 off-premises losses, overwhelmingly of traveling jewelry salespersons and trunk show personnel. Since then, there has been a steady decline in this category of crime. In 2020 JSA received just 34 reports of such crimes. Important contributing factors regarding this reduction are the dedicated interest by law enforcement, particularly the FBI in cooperation with local law enforcement agencies; the greatly reduced number of traveling jewelry salespeople on the road due to the changing methods of jewelry distribution and sales; and greater education and information sharing regarding suspects and criminal gangs by jewelry firms and police.
Read complete JSA 2020 Crime Report