2021 Gold Demand Increases 10%
The full-year 2021 gold demand (excluding OTC) increased to 4,021 tonnes (t), propelled by Q4 demand, which jumped almost 50% to a 10-quarter high. Demand recouped much of the COVID-related losses sustained during 2020. Demand for gold in the consumer-driven jewelry and technology sectors recovered throughout the year in line with economic growth and sentiment, while central bank buying also far outpaced that of 2020. Investment demand was mixed in an environment of opposing forces: high inflation competed with rising yields for investors’ attention.
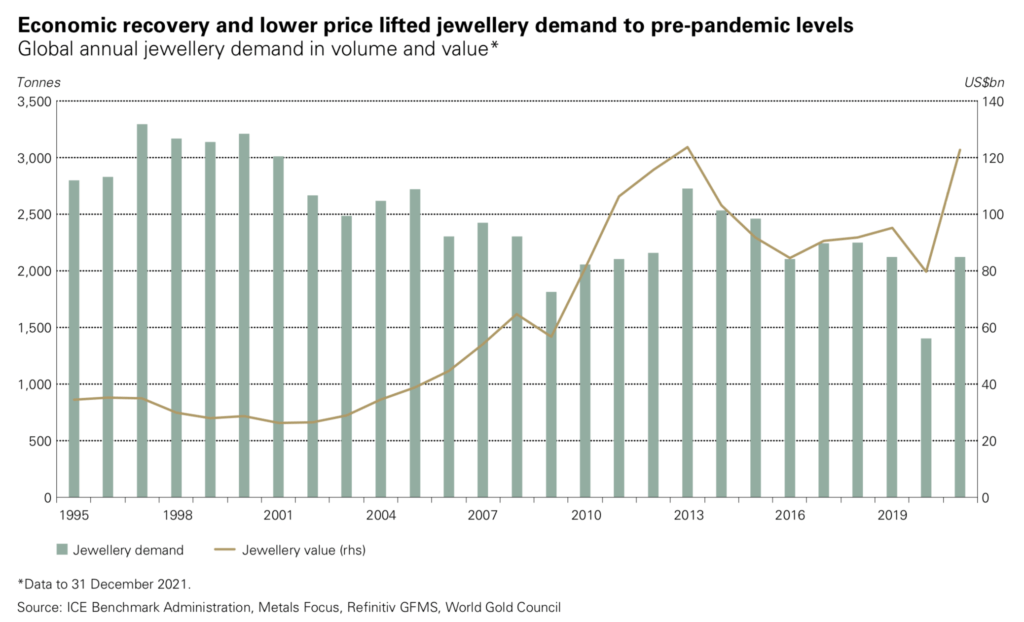
Jewelry fabrication staged a strong recovery in 2021. It grew 67% to 2,221t to meet the strong rebound in jewelry consumer demand, which increased 52% in 2021 to 2,124t, matching the 2019 total. This was in good part linked to Q4 demand, which – at 713t – saw the strongest quarterly jewelry consumption since Q2 2013.
Global holdings of gold ETFs fell by 173t in 2021, in sharp contrast to 2020’s record 874t increase. Q4 outflows of just 18t were a fraction of the much larger outflows seen in Q4 2020.
Bar and coin investment maintained its momentum, jumping 31% to an eight-year high of 1,180t. Q4 2021 demand of 318t, meanwhile, was the highest for a fourth quarter since 2016.
Central banks accumulated 463t of gold in 2021, 82% higher than 2020, lifting global reserves to a near 30-year high. The pace of buying slowed in the second half, with a 22% year-over-year decline in Q4.
Gold used in technology grew 9% in 2021 to reach a three-year high of 330t. Year-over-year growth slowed in the most recent quarter (to 2%), highlighting the rapid recovery seen in the sector in Q4 2020.
Highlights
The US dollar gold price declined by around 4% during 2021. Nevertheless, the average price for the year of US$1,799/oz was around 2% higher than in 2020, as the price was relatively steady, holding within a broad range for much of the year.
Total gold supply eased marginally in 2021: down 1% at 4,666t, its lowest level since 2017. Mine production recovered 2% over the year, but this growth was counteracted by a sharp 11% drop in recycling.
Jewelry growth was almost universal. Gains were fuelled primarily by the two global heavyweights – India and China – but decent recovery was also seen across all other regions.
Inflation-driven retail investment reached record levels in some Western markets. Bar and coin demand exceeded previous annual levels in both the US and Germany as investors focused on rising inflationary pressures and low/ negative real rates.
Gold drew direction chiefly from inflation and interest rate expectations in 2021. Investment may struggle in 2022 amid competing forces, but consumer demand should hold strong, and central banks will likely keep buying.
• The gold price ended 2021 around 4% lower, closing the year at US$1,806/oz, while its annual average of US$1,799/oz was approximately 2% higher than the 2020 average
• ETFs and OTC demand experienced weakness in 2021 while bar and coin climbed, with some regions posting decade-high levels of demand
• Consumer demand was supported by the economic recovery, ease of lockdown restrictions, and softer gold price performance.
Looking ahead:
• Investment may face challenges from rising rates, and the recent strong increase in bar and coin demand may be an additional headwind to further growth, but persistently high inflation and equity market pullbacks will likely be supportive
• Consumer-driven demand should benefit from a weaker price environment with good underlying economic growth
• Central banks are expected to continue buying gold but at a slower pace than in 2021
• Expected growth in mine supply, due to fewer COVID disruptions and ramp-ups/first pours at various mines, is likely to be offset by a fall in recycling, which would leave total gold supply largely unchanged.
Q4 and Full-Year Review
The year ended much as it began, with nominal interest rates and inflation jockeying for position as the key driver of gold. But unlike in Q1, inflation was a more dominant factor than interest rates in Q4. This helped gold make up some of the ground it had lost early in the year.
While the price of gold finished the year 4% lower, the average price for 2021 was almost 2% higher than the average price seen in 2020. This performance is well explained by the gold market dynamics observed in 2021.
The tug-of-war between interest rates and inflation was reflected in investment demand and created a drag on prices. Gold ETF outflows – concentrated in North America – were a feature for most of the year, bringing collective gold holdings in ETFs down 173t by the end of the year. Interest rates, representing the opportunity cost for holding gold, have historically been a critical determinant of ETF flows, and last year was no exception. US 10-year Treasury yields ended the year 40 bps higher, and shorter maturities like the US 2-year Treasury yields – reflective of market expectations of future Fed policy – rose almost every month of the year. These higher nominal yields helped put downward pressure on gold ETF holdings. Yet despite considerable outflows during the year, global holdings of these products remain significantly above pre-pandemic levels, likely reflecting the fact that much of 2020’s record inflows were due to longer-term, strategic buying.
Bar and coin demand, which our analysis suggests is more sensitive to changes in inflation than interest rates, ended the year 281t higher, helped by decades-high demand in both Europe and North America.
The solid recovery in jewelry demand was also supportive of gold. The market witnessed a strong bounce back from the pandemic-ravaged slump of 2020. Demand finished the year with a somewhat surprising surge as Indian buying hit a quarterly record. Chinese demand was also impressive, posting one of its strongest Q4 numbers on record.
Meanwhile, central bank buying offered further reinforcement, mainly through the year’s first three quarters. A few large-scale purchases by banks, including Thailand and Brazil, added to the regular buying of smaller amounts by the likes of India and Uzbekistan to generate more than 460t of buying in 2021.
And gold’s relative stability throughout the second half reflects this combination of subsiding ETF outflows and strength in the consumer and central bank elements of demand.
Finally, supply had a somewhat neutral effect as higher marginally mine production was counterbalanced by considerably lower recycling.
Outlook
Consumer-driven demand for jewelry and technology will likely remain solid in 2022 amid generally strong economic growth and could be further supported if the gold price were to move sideways or soften. However, the pent-up demand we saw in Q4 will probably subside in 2022 as some of it has likely already been met.
Demand in China for the beginning of 2022 could be restrained by increasing COVID-related restrictions and the current economic slowdown. For the rest of the year, slower growth could hamper demand, but it could benefit from lower price volatility.
Technology demand is expected to show a further modest rise this year as it continues to recover from a weak 2020. The continued expansion of 5G infrastructure should help support the demand for gold in this sector. However, demand faces some risks from a slowdown in China as well as COVID-related restrictions.
Investment demand is likely to be pressured by higher nominal interest rates again in 2022 but could benefit from continued inflation concerns and COVID risks.
Bond yields have started the year on the front foot. This trend is likely to continue as long as central banks maintain a hawkish tone, thus increasing the opportunity cost for gold. Yet, gold has remained resilient in the first few weeks of the year, likely as a by-product of perceived continued risks.
Further, rising policy rates and the end of bond-buying programs could be detrimental to financial markets much as they have arguably been very supportive over the last few years. Equity markets continue to ignore bad news, but a stronger pullback remains a major risk, given valuations and earnings prospects. Bonds will not fare well in a rising environment, and if supply chain restrictions are eased, then commodity prices may soften.
In addition, rising policy rates are not exactly uncharted waters, but the experience from 2018-2019 suggests that the economy is more sensitive to higher rates, given that debt levels are substantially higher. This poses the risk of a growth slowdown and a fall in long-term real interest rates.
Finally, gold has historically outperformed in the months following the onset of a US Fed tightening cycle.
ETF demand could largely see a repeat of 2021 with both economic resilience and higher nominal interest rates as headwinds. However, continued inflationary pressures, financial market wobbles, and COVID restrictions present upside risks. The outflows that gold ETFs experienced in 2021 should be put into context, considering that they collectively added 2,200 tonnes between 2016 and 2020. The direction of ETFs will largely depend on which factor is stronger: demand for gold as a hedge in light of persistent inflation and potential COVID-related market pullbacks or further reduction in holdings in light of rising nominal interest rates.
Bar and coin demand is expected to be rangebound in 2022 compared to 2021, potentially weaker in some regions within an overall range of 1,000 to 1,200t. Price volatility and continued inflation concerns may help demand, but after two strong years, some buying exhaustion may have set in. There is, however, some upside in China. Potential currency weakness and higher local inflation, alongside continued low bond yields, are all encouraging for Chinese bar and coin investment.
In India, loosening restrictions have produced bumper numbers for Q4 2021. Some of this will likely wane in 2022, but economic growth should remain a catalyst for solid demand.
Central bank demand is likely to continue its positive 12-year trend but may struggle to match the strong performance of 2021. There were major strategic purchases in 2021 that may not repeat soon, and previous significant buyers, such as Russia and China, have been relatively inactive in recent years. Both of these factors create more uncertainty around expectations, as do developments in Turkey, which could have a significant bearing on demand numbers. However, our central banks’ survey indicates a similarly positive inclination towards gold in 2022 as in 2021.
Supply is expected to be marginally softer in aggregate, with mine supply rising slightly but being outweighed by a fall in recycled gold.
Mine production can achieve similar growth in 2022 to 2021. Margins remain healthy despite rising costs, incentivizing continued production. Certain risks to this growth stem from continued COVID-related disruptions and, of course, operational issues.
Recycling is likely to fall in 2022, and we expect a range of 1,050t–1,110t for the full year. Global real GDP growth is expected to be solid, reducing the need for distress selling. As in 2021, government support could factor limit the need to sell, and any price weakness – should it materialize – would act as a further disincentive. Higher inflation has also reduced the willingness to recycle, and near-market supplies continue to be constrained after the historically high levels of recycling seen in 2019 and 2020.
Jewelry
Annual jewelry consumption rebounded to pre-pandemic levels, boosted by the Q4 sprint finish.
- Annual jewelry consumption grew 52% in 2021, fully recovering the losses sustained during 2020
- Rocketing Indian demand helped drive the fourth quarter global total to 713t – the highest since Q2 2013
- In value terms, annual demand reached US$123 billion (bn) to match the 2013 record virtually.
2021 was a redemption story for global jewelry demand as it recovered fully from the blows inflicted by COVID-19 in 2020. Demand by consumers reached 2,124t,4 lifted by an exceptional fourth quarter, with the release of pent-up demand in India being a key factor
Jewelry fabrication rose 67% to 2,221t – the highest since 2018 – in response to strong consumer demand and inventory building of 97t during the year. This inventory replenishment compensated for the 74t of stock depletion seen in 2020 as the jewelry trade battled with the impact of the pandemic.
Strong growth in the first three quarters of 2021 was largely due to base effects (i.e., the extreme weakness of 2020). The fourth quarter, however, had a fairer comparison as Q4 2020 had been robust. This makes the 40% y-o-y increase in the most recent quarter all the more impressive.
India was a key driver in Q4, but jewelry demand in markets across the globe – almost without exception – was stronger y-o-y. Key reasons were the Continued economic recovery and the less widespread use of strict lockdown measures to contain COVID-19.
While many markets have continued to ease restrictions, it is worth noting that varying degrees of market lockdown across the globe continue to impinge on data collection, making data for some markets more susceptible than usual to future revisions once customary fieldwork can resume.
China
Double-digit y-o-y growth in Q4 concluded a strong 2021 for gold jewelry demand in China. In 2021, China’s gold jewelry demand reached 675t, a 63% jump y-o-y and 6% higher than in 2019. Demand was primarily supported by economic recovery from 2020 and a relatively stable gold price during the year. The surging popularity of Heritage gold jewelry items5 and increasing adoption of the per-gram pricing method also contributed. In addition, we believe pent-up wedding gold jewelry demand from 2020 supported China’s growth in 2021.
Meanwhile, a relatively stable gold price and seasonal factors – Chinese consumers tend to buy gold products ahead of the Chinese New Year Festival – were the main drivers of the 24% y-o-y growth in the fourth quarter.
Mass-appeal 24K products lost market share to more intricately designed ranges. The reason for this was two-fold. On the one hand, manufacturers are catering to the demand for aesthetic consideration of modern (mainly Gen Y and Gen Z) Chinese consumers, who require higher jewelry design standards. This is especially evident in higher-tier cities. Heritage gold jewelry’s rocketing popularity among these consumers is a quintessential example.
On the other hand, as local retailers increase the range of per-gram priced products in their inventory, they prefer to focus on items with higher added value from craftsmanship in order to pursue higher margins. While mass-appeal 24K gold jewelry maintains its popularity in some regions, market share could fall further as products with more intricate designs gain greater prominence.
Meanwhile, the share of plain 18K and 22K product ranges is shrinking. This is likely caused by the rising popularity of 24K Hard Gold jewelry products in recent years.6 Since their inception, these well-designed, light-weight products have been gnawing away at the market share of plain 18K and 22K gold jewelry: our survey results show that the latter items only accounted for 13% of local retailers’ inventories in 2021, lower than that of 24K Hard Gold pieces.
Looking ahead, a possible slowdown in China’s economic growth and the trend of declining marriage registrations might present challenges. However, a stable or declining gold price could provide support. We believe demand should benefit from continued migration to the per-gram pricing method increasingly adopted by local retailers as well as from the expansion in leading retailers’ points of sale.
India
Indian gold jewelry demand almost doubled y-o-y in 2021, surging past pre-pandemic levels to reach a six-year high of 611t. Record quarterly demand of 265t in Q4 set the seal on this remarkable annual performance.
With the easing of lockdown restrictions from June onwards and the continued successful rollout of the vaccination program, India’s economy recovered in H2 2021. This boosted consumer sentiment – particularly in urban India – as reflected in an increase in the Reserve Bank of India’s Consumer Confidence Index, which rose to 62.3 in November 2021. Rural demand was supported by normal monsoon rainfall, although crop loss due to floods in the Southern states of Kerala and Tamil Nadu impacted rural demand to a degree.
Festivals and weddings were the driving force behind robust Q4 demand. Jewelry demand remained strong in October with festival purchases of Dussehra and Pushya Nakshatra, followed by a robust Dhanteras, with retailers reporting sales volumes above those of pre-pandemic levels.
Weddings boosted jewelry demand further in the quarter. Pent-up demand from weddings deferred during Q2 and re-scheduled for Q4 2021 provided a fillip, as did the higher number of auspicious wedding days in Q4 (15 in Q4 2021 vs seven in Q4 2020). With higher wedding purchases and a stable price, consumers preferred gold-for-gold exchange.
As the year ahead unfolds, jewelry demand in India should receive support from continued improvement in consumer confidence and income levels. But there are likely challenges, too. COVID-19 remains a significant factor, the latest wave of the pandemic prompting renewed Uncertainty and fresh restrictions on the size of weddings and social gatherings, and this sees weddings postponed from Q1 to later in the year. Likewise, the sharp release of pent-up demand in Q4 is less likely to be repeated to the same degree in 2022.
Middle East and Turkey
Full-year 2021 jewelry demand in Turkey and across much of the Middle East fell short of a return to pre-pandemic levels.
Turkish jewelry consumers were discouraged by extreme currency-induced volatility in the local gold price during Q4. The gold price was relatively stable during the first few weeks of the quarter, which permitted a 9% y-o-y increase in Q4 demand to 7.4t. However, the subsequent sharp rise and rapid correction in the local price later in the quarter saw demand slow to a virtual standstill; as a result, Q4 demand was down 20% from the third quarter. Annual demand recovered to 34t (+31% y-o-y), restrained by the precarious economic situation and surging inflation.
Markets in the Middle East all witnessed significant double-digit y-o-y growth rates in 2021. The UAE led with a 57% increase in annual demand to 34t. Continued improvement in tourist numbers, especially from India, aided this growth, while the relatively effective containment of COVID generated a positive mood that helped local demand.
The West
US jewelry demand was the strongest for 12 years at 149t (+26%). The value of annual demand was the highest in our series by some margin, at US$8bn. All four quarters saw healthy y-o-y growth, with Q4 demand up 9% y-o-y and 8% higher than the same quarter of 2019. Demand growth was generally considered to be due to the lack of competition for discretionary spending, given the ongoing lull in spending on travel and entertainment. Postponed weddings that were rescheduled to the most recent quarter also had an impact.
A contributing factor to robust demand volumes was the healthy interest in plain gold items, including heavy chains, and the continued dominance of 14-carat pieces, with the very low 6- and 1-carat ranges having failed to gain traction.
Jewelry demand in Europe continued its recovery in 2021 but fell short of pre-pandemic levels. Annual demand for the region grew 21% to 68t. Fourth-quarter demand was broadly in line with pre-pandemic averages, but the continued interference from restrictions to combat the spread of COVID prevented a full recovery in demand across the region.
ASEAN Markets
Demand for jewelry in Indonesia was 27t for the full year, an increase on the 21t of purchases in 2020 but still well below the 40t annual average of the preceding five years. Q4 jewelry demand in Indonesia rose 26% y-o-y to 10t. Consumer confidence was likely buoyed by the country’s relative success in dealing with the pandemic. New cases fell significantly after peaking in July 2021, and the economy began to normalize following the easing of lockdowns in Q4. GDP growth of 4.5% in the final quarter and the fall in gold prices in November and December likely supported jewelry consumption.
Annual demand for gold jewelry in Thailand was 8t, a 38% increase on 2020’s 6t. In the fourth quarter, jewelry consumption was 20% higher y-o-y – the third consecutive quarter of y-o-y growth. This was the strongest quarter since the pandemic began and reflects Thailand’s continued recovery from the effects of COVID-19. While the jewelry market has improved, consumers are still reluctant to make big-ticket purchases. Tourism has only recently resumed, but arrivals are expected to increase significantly in 2022, likely boosting demand further.
2021 demand for jewelry in Vietnam was 12t, 11% higher than the 2020 figure of 11t. But the fourth quarter saw a 12% y-o-y fall to 2.5t, as the market was hit hard by COVID. Jewelry shops were allowed to reopen in October, but the severe effects of the Vietnam pandemic have made consumers cautious about making high-value purchases. Despite this, sales picked up in November, reflected in strong q-o-q growth, with promotional campaigns and the wedding season contributing to the recovery. Demand will likely continue to rise as Vietnam’s economic recovery boosts consumer confidence. Q4 GDP grew 5.2%, and a major government stimulus package is likely to support further recovery.
Jewelry consumption in Singapore increased by 16% y-o-y to 2t in Q4. Annual demand in 2021 was 7t, a 22% increase on the 6t of 2020. Jewelry shops remained open throughout the year, and limited tourism began to resume in H2, which will likely support the market throughout 2022.
Annual jewelry consumption in Malaysia rose by 10% to 10t, with a 37% y-o-y increase in Q4 to 4t. Lockdowns were eased in August, and pent-up demand and seasonal buying continued to support the jewelry market in the final quarter.
Rest of Asia
Jewelry demand in Japan continued to recover, with volumes nearly back to pre-pandemic levels: annual demand was up 12% at 15t. Fourth quarter consumption increased by 9% to 5t, the third consecutive quarter of growth.
Fourth quarter jewelry demand in South Korea rose by 5% y-o-y to 5t. This was supported by the wedding season, year-end promotions, and a weaker gold price. Demand for the full year 2021 was 19t, an increase on the 16t purchased in 2020.
View the complete World Gold Council Gold 2021 Gold Demand Report