Digital Analytics 101

Understanding your audience and its behavior is essential to being able to reach it and advertise effectively. Be sure to utilize the analytics function found on social media platforms and websites to better understand how your audience behaves and to ensure a strategic marketing approach.
Social Media Insights
For business accounts, social media platforms track audience information (demographics and activity) which provides a business with invaluable insights into how its audience interacts with its content. It is important to confirm that you have a Business Profile set up on Instagram and a Business Page set up on Facebook to allow for these free analytics.
Instagram Insights
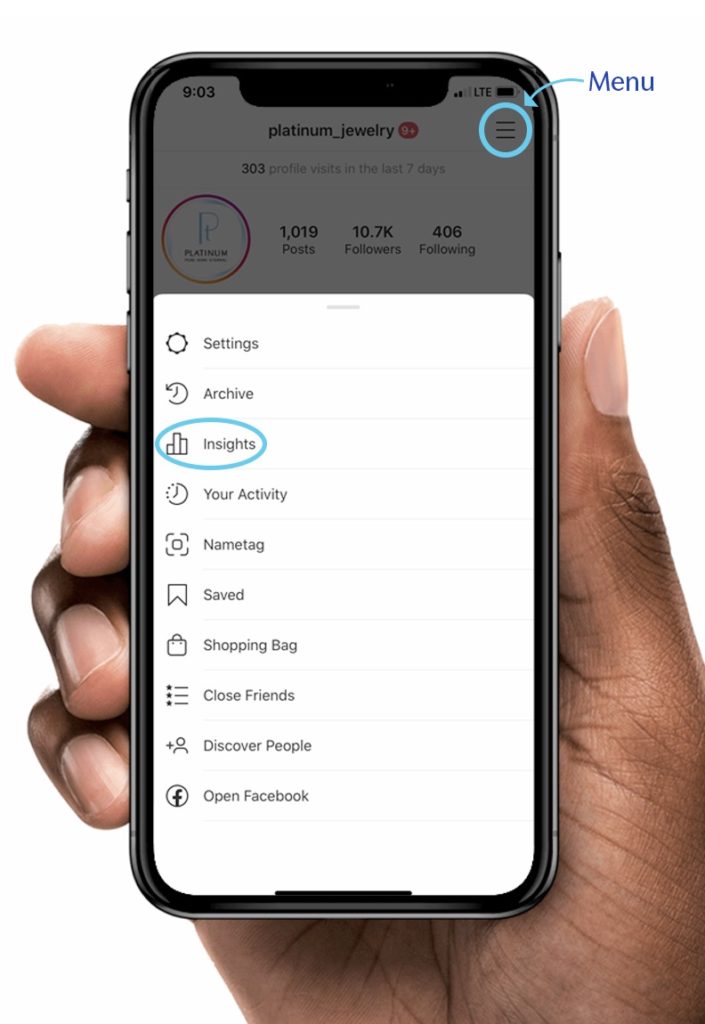
Access your insights by clicking the menu bar on the top right of your profile and then choosing the “Insights” option. On that page, you will be able to view the following information:
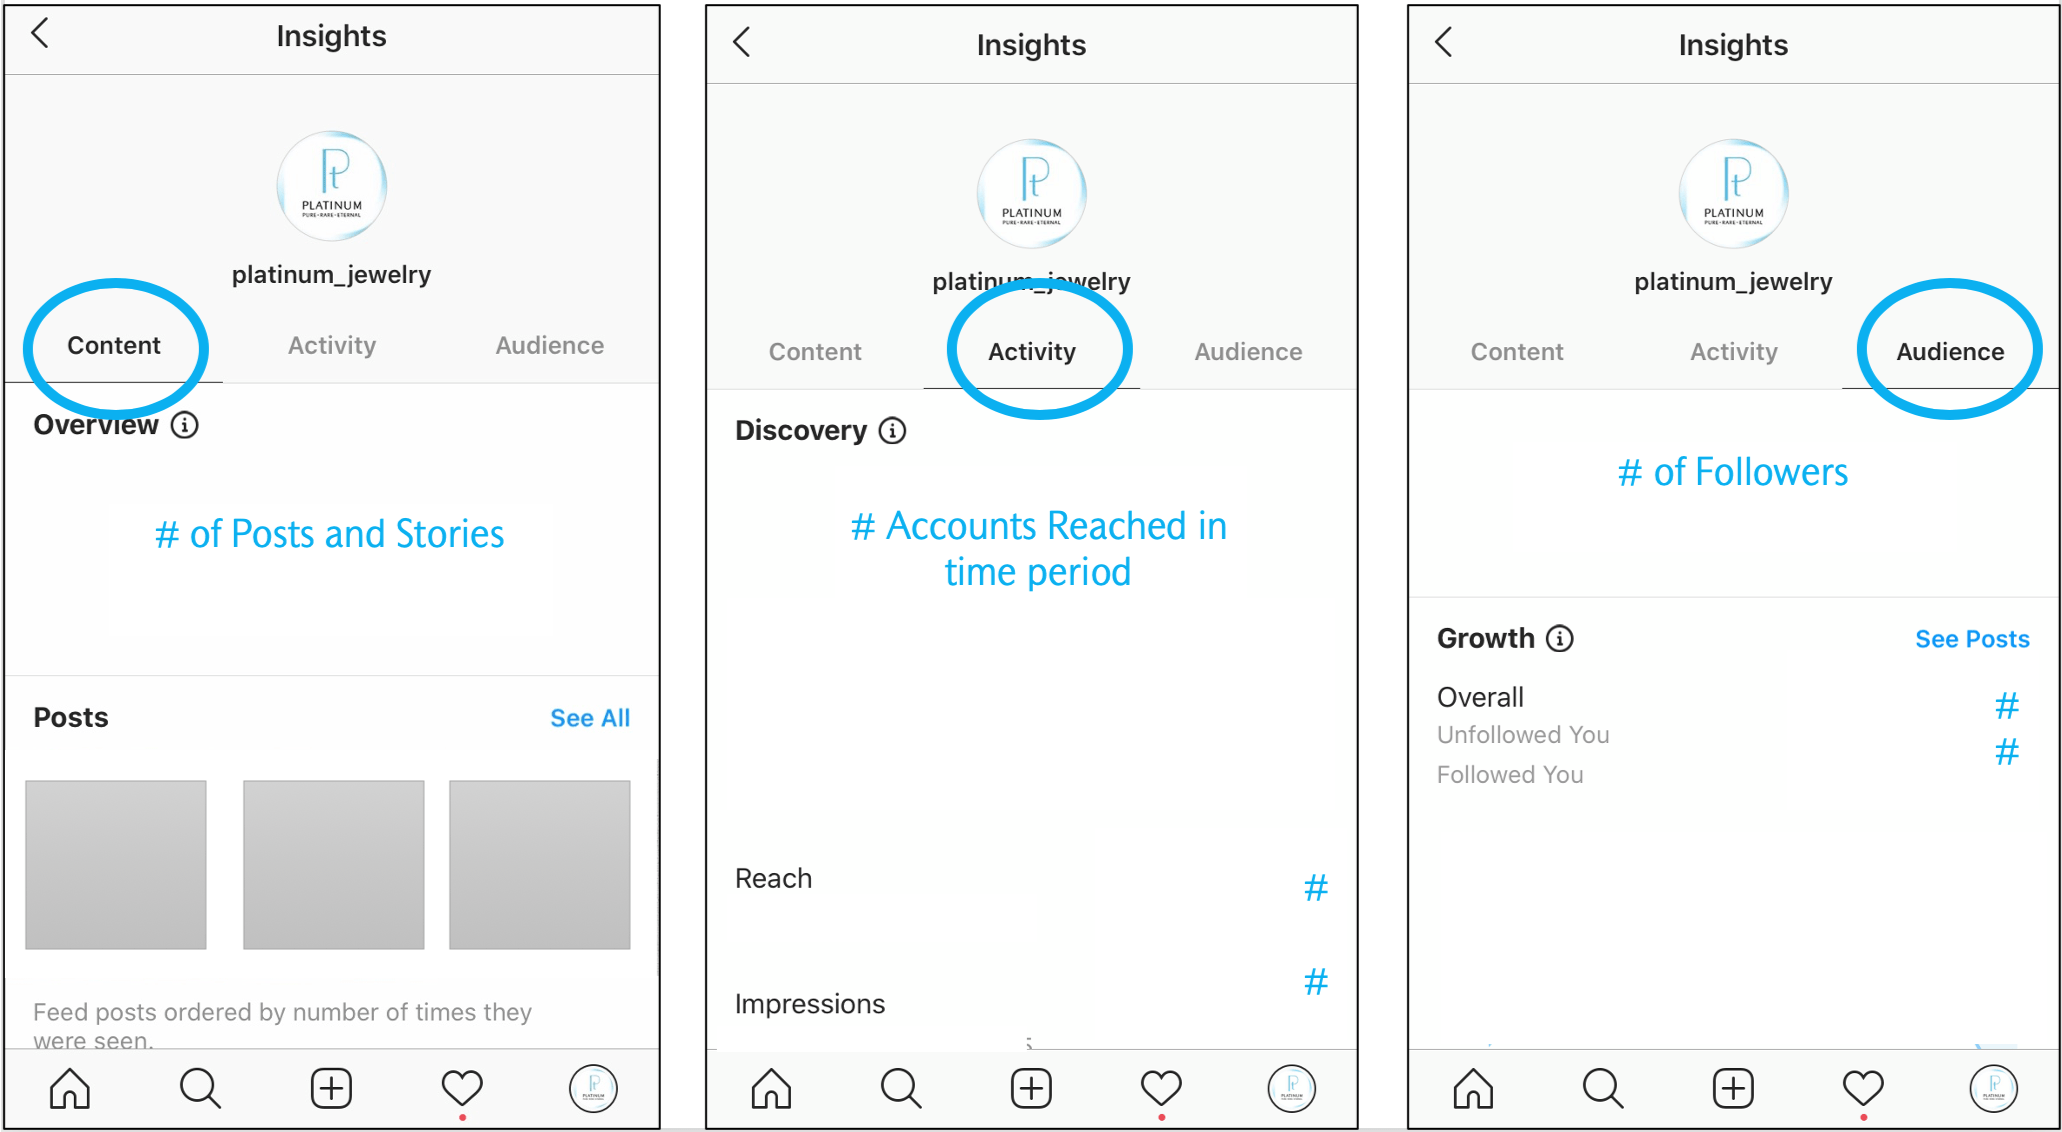
Content Tab: See all of your posts (up to two years) and stories (up to 14 days) and how they performed. Older stories and their metrics can be saved in your archive by marking ‘Save to Archive’ in story settings. The best measurement of your posts’ successes is interactions (likes, comments, saves, and shares). Even better: look at the engagement rate (calculated by dividing interactions by post impressions) to analyze which types of posts perform better and to compare the effects of your different efforts over time.
Activity Tab: View your account’s recent reach, impressions, profile visits, and website clicks from the last seven days compared to the previous seven days. You can see how your account has performed over the most recent week and line that up against other promotional efforts (ex, if you were featured in a blogger’s post, then you would want to see if that mention resulted in a peak in activity compared to the week prior without any external influence).
Audience Tab: Track the growth of your follower base. In this section, you are able to learn about your audience’s demographics (location, age, gender), which can (A) help you tailor your content to better resonate with your audience or (B) alert you to the need to refine your strategy if you are attracting an audience that does not align with your business objectives. This tab also shares follower activity based on the time of day in relation to each day of the week, which can help you determine the best day/time combination to post.
Facebook Insights
Facebook Page Analytics can be found by clicking the “Insights” tab on the top of your page.
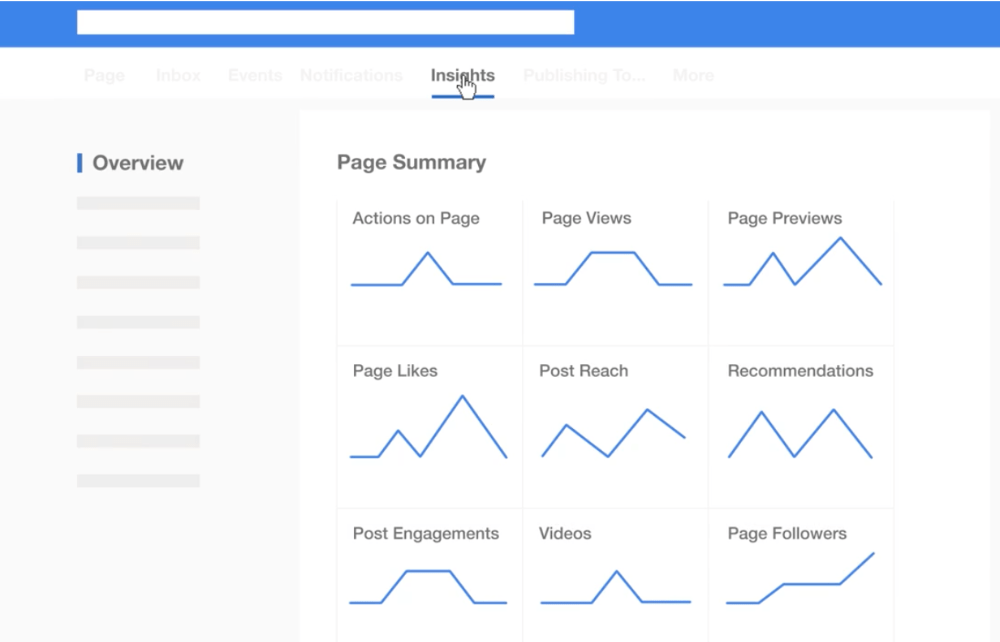
The Overview: Under the Insights tab, select “The Overview” to find important, top-level page metrics (see key terms defined below) that can give you insight into how your page is performing and how your audience is interacting with it. Under this section, you will find updates like number of new likes, followers, page views, and post engagement, as well as be able to track your responsiveness and recommendations (when users recommend your business to their followers).
Posts: In the Posts section, you can view a graph of “When Your Fans are Online,” averaged over a time period of your choice. This is very helpful for deciding when to post. You can also see your Post Types, which is an aggregate view of how well different types of posts perform with your audience. These tools can support future content creation to better resonate with your audience. Under All Posts Published, you can view the following information on all of your past posts:
- Type: Link, photo, video, etc.
- Targeting: See if a specific audience was targeted and if it was a public post.
- Reach The number of people who saw your post. Hold your mouse over the yellow bar to view a breakdown of paid vs. organic reach.
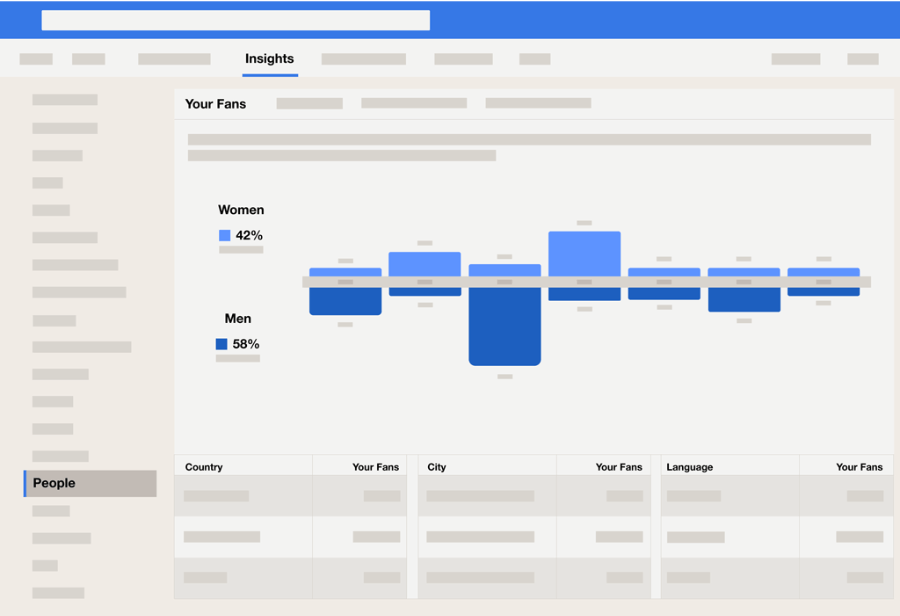
People: This section shares a demographic breakdown of the people visiting your page. In Actions on Page, you can see who clicked on your contact information or website… broken down by age and gender, country, city, and device. More detailed audience information can be found on Facebook’s Audience Insights tool.
Recommendations
- Based on your insights, create a content calendar to schedule your posts on the days and times when your audience is most active.
- Check in often: this data updates constantly, so you’ll want to analyze it often to look for patterns and trends. You can also click “Export Data” at the top right of your Overview tab on Facebook to download your page data.
- Respond to messages and comments as quickly as possible. This builds trust by showing you’re attentive and engaged.
- If your audience demographic doesn’t align with your ideal customer, consider targeting your posts toward a more specific audience. Try different promotion strategies and track your insights to see the response.
Important Terms to Know
- Website Clicks: Number of users who have clicked on the link in your Instagram bio.
- Profile Visits: Number of users who have visited your Instagram profile.
- Actions on Page: Number of combined clicks on your contact information and call-to-action button.
- Page Views: Total views of your Facebook Page.
- Page Previews: Number of times users held their mouse over your Page information to see a preview of your Page.
- Post Reach: Number of unique users who saw your posts.
- Post Impressions: Total number of times your post was seen.
- Post Engagement: Combined total of post likes, comments, shares, and other engagements.
- Responsiveness: Evaluation of how often and how fast you respond to messages.
Social media is an effective way to reach a large population and define your brand, but it doesn’t exist alone. Social can support or amplify your other efforts, and it’s important to create an integrated strategy across all of your platforms.
Web Analytics
Understanding your audience and its behavior is essential to being able to reach it and advertise to it effectively. We shared in a previous newsletter the best practices for leveraging analytics on your social media platforms, and now want to review the importance of understanding visitor behavior on your websites. With a stronger shift to an omnichannel world, it is imperative you strengthen the digital side of your business to ensure a strategic marketing approach.
Tracking analytics for your website is essential to understanding the demographics and behavior of your audience and then building an effective marketing and communications strategy. It’s highly recommended to link your site with Google Analytics, a free website analytics service that can provide you with very detailed reports. Read our introductory guide below for tips on how to begin tracking with Google Analytics and the key data to examine, including audience information and behavior.
First, make sure you have a Google Analytics account set up. Go to analytics.google.com, and sign in, or click “Set Up For Free.” Then, follow the instructions to set up a property within your analytics account, which is the collection point of data from your website. Follow the steps to add the tracking code to your website. Later, you can modify this tracking code to collect additional data.
Tip: The platform you use to manage your site may offer a simple plugin that makes code installation a breeze.
For e-commerce sites, it’s very important to properly enable ecommerce, ideally advanced ecommerce reporting as well. This will often require a developer to be done correctly.
Your Google Analytics Homepage
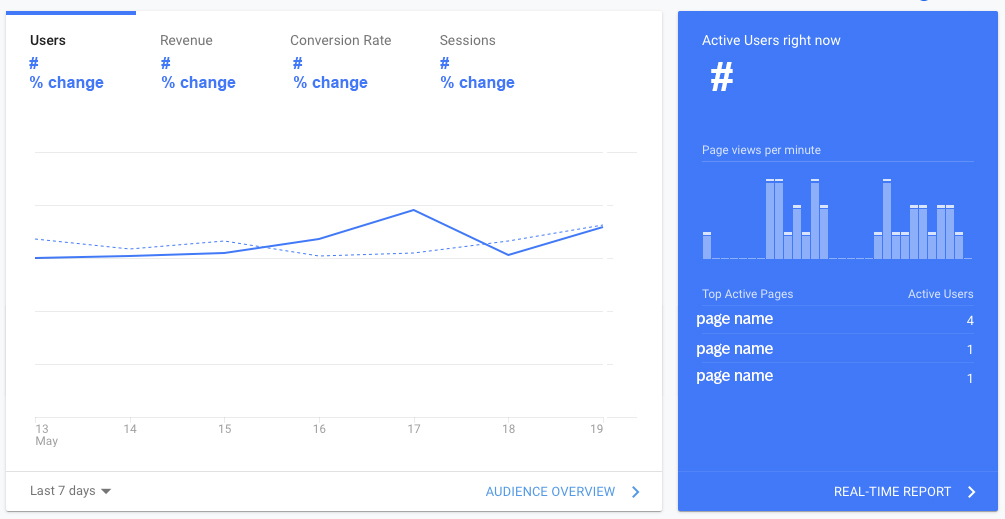
On your Homepage, you’ll see an overview of key statistics over a recent time period of your choice (default is 7 days) as well as a real-time report of current active users. Note any significant changes in users, revenue, and sessions. Scroll down on your homepage to see other key data such as:
- How you acquire users
- Where your users are geographically
- When users visit (frequency based on day & time)
- Top pages visited
- What devices visitors are using
- User retention (week by week)
- Top-selling products (if applicable)
Available Reports on Google Analytics
On the menu on the left-hand side of your Analytics platform, you’ll see a list of Reports you can view. This is where you’ll find extensive, constantly updating reports on your site’s data. There are many subcategories containing more detail- a great way to start is by exploring these different reports and categories. Google provides definitions for many terms that may be unfamiliar if you roll your cursor over the “question mark” beside them. You can create additional custom reports, but the four key categories are below:
Real-Time Reports provide a current overview of users on your site, including location, traffic source, content/pageviews, and conversion.
Acquisition Reports are very important because they show you how people are arriving at your website. This allows you to judge the effectiveness of efforts such as emails, social promotion, ad campaigns, and searches. If you find certain channels drive a lot of site traffic, you can spend more time and effort on these in the future.
Behavior Reports provide information on user behavior, including page views, amount of time spent on different pages, searches performed, site speed, and behavior flow. Understanding how your audience moves through your website is a great insight into their thought process and can help you design a better user experience.
Conversion Reports show conversion rates and product performance information like add-to-carts. A conversion is when a session reaches its goal, such as an online purchase. Conversion rates represent the number of visitors who complete the desired action, calculated by dividing the number of conversions by the total number of visits. This report is very useful for e-commerce sites.
Enhance Your Knowledge
Google Analytics contains a vast amount of information that can feel overwhelming to navigate at first. To get the most out of your analytics, you can take free online courses on the Google Analytics Academy.
Source: Platinum Guild International