Gold Demand Down 8% in Q2 2022
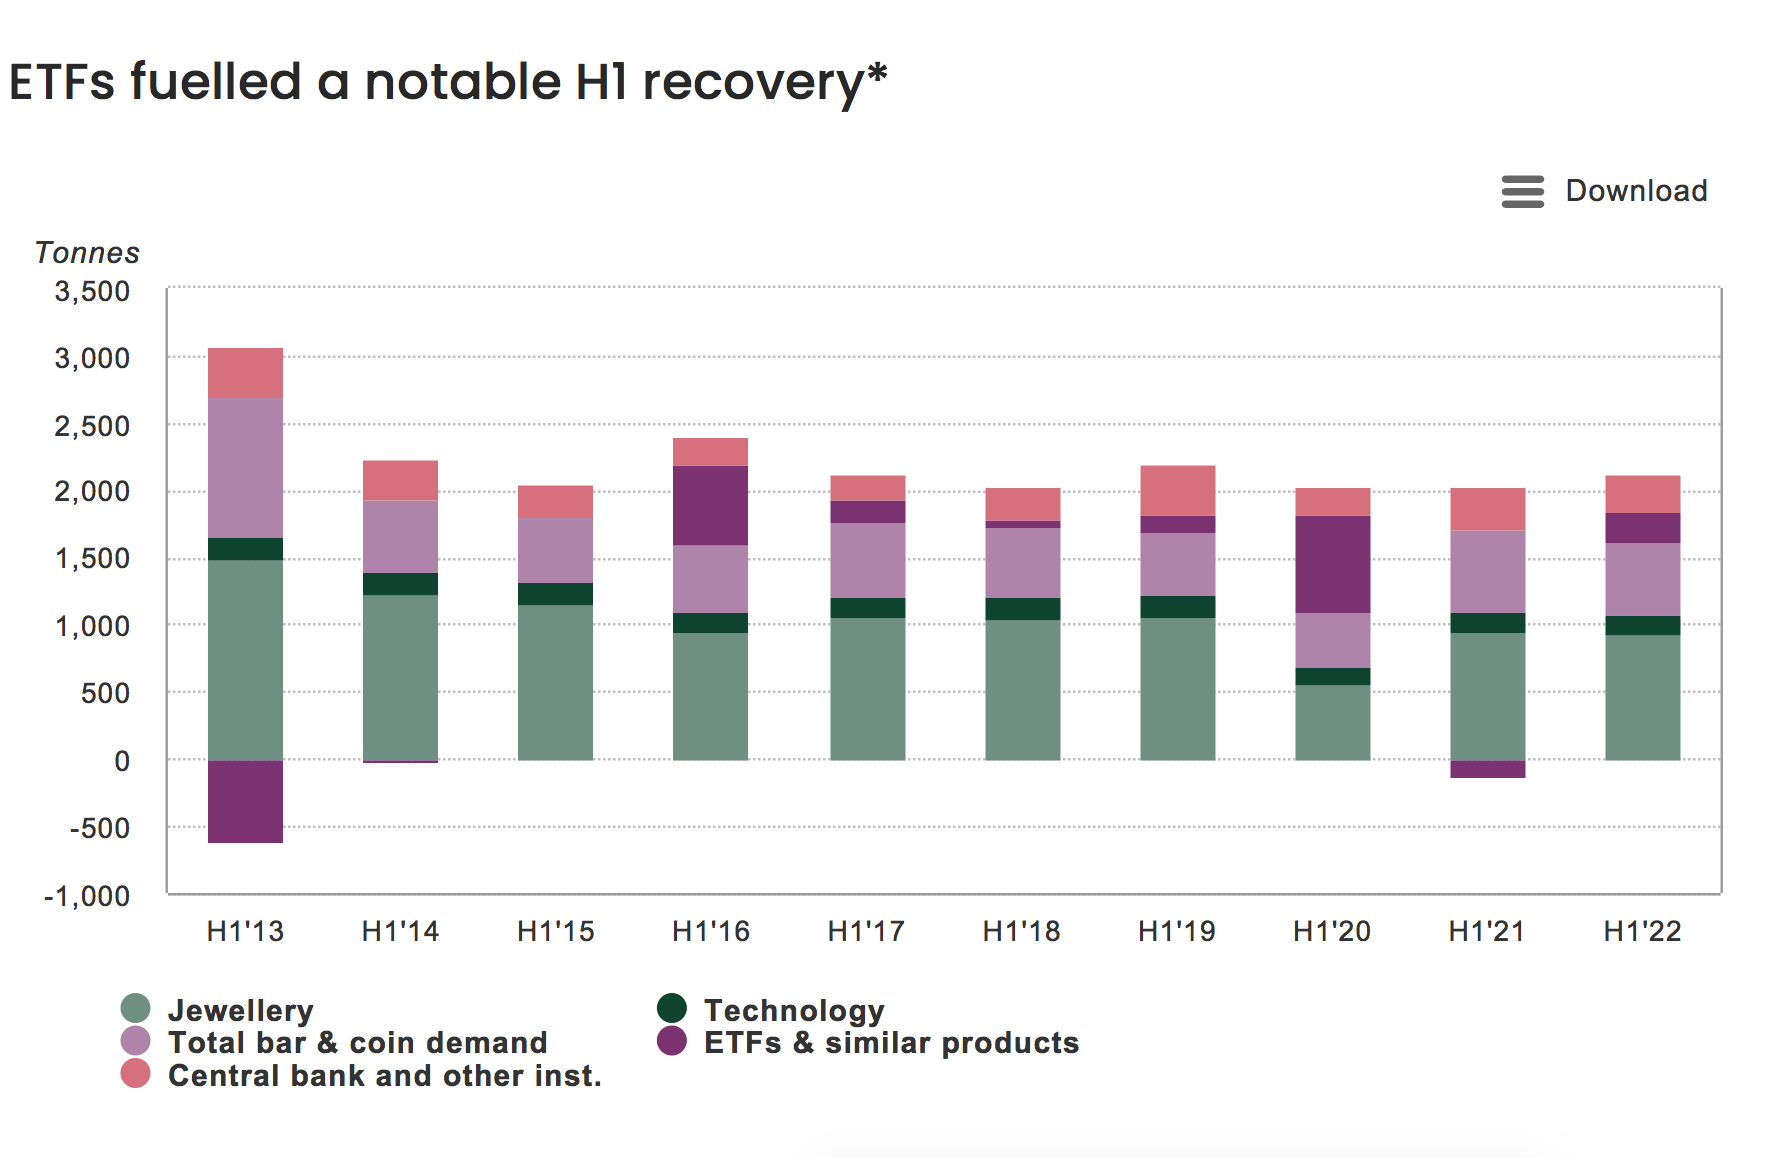
Despite Q2 weakness, strong first quarter ETF inflows fueled a notable H1 recovery
Gold demand (excluding OTC) was 8% lower y-o-y at 948t. Combined with Q1 this took H1 demand to 2,189t, up 12% y-o-y.
The LBMA Gold price PM averaged US$1,871/oz in Q2, 3% above the Q2’21 average. However, this comparison conceals the 6% decline in the price during the most recent quarter, pressured by rising interest rates and the rocketing value of the US dollar.
As the gold price fell in Q2, gold ETFs lost 39t, giving back some of the strong Q1 gains. Net H1 inflows totaled 234t compared with 127t of outflows in H1’21.
Bar and coin investment (245t) was unchanged from Q2’21 as a sharp drop in China was offset by growth in India, the Middle East and Turkey. The H1 total saw a 12% y-o-y drop to 526t on compounded Chinese weakness.
Q2 jewelry consumer demand reached 453t, 4% higher y-o-y, although the comparison is with a fairly weak Q2’21. Total H1 jewelry demand of 928t was 2% below H1’21.
Central banks continued to buy gold. Global official gold reserves grew by 180t in Q2, taking H1 net purchases to 270t.
Technology demand dipped in Q2, down 2% y-o-y to 78t on weaker demand for consumer electronics. H1 demand was fractionally lower as a result at 159t.
Other highlights
The LBMA gold price PM (US$/oz) lost 6% in Q2 but firmed marginally over H1 (+1%). Much of the Q2 weakness was related to the strength of the dollar; the gold price denominated in many other currencies was contrastingly different.
Continued growth in the second quarter lifted H1 mine production 3% to 1,764t – a record first half for our data series. Mine production benefited from an absence of COVID-related lockdowns and was boosted by continued recovery in China following safety stoppages in 2021.
Recycling activity remained elevated compared with 2021. Total H1 recycling of 592t was 8% higher y-o-y. Higher average price levels, combined with increased economic hardship in many regions, supported recycling volumes.
The strict zero-COVID policy in China had a significant impact on total bar and coin investment and jewelry demand. Lockdowns imposed in several key cities and regions throughout much of Q2 meant that access to retail outlets was cut off to large swathes of consumers.
Jewelry
Gold jewelry demand up vs Q2 2021 but below typical pre-pandemic quarterly levels
- Q2 jewelry consumption was 4% higher y-o-y at 453t as growth in India and the Middle East outweighed declines in China and Russia
- Demand remains anemic on a longer-term basis, 10% below the five-year quarterly average of 505t
- H1 total demand (928t) was 2% down on H1’21, but 12% below 2019 pre-pandemic levels.
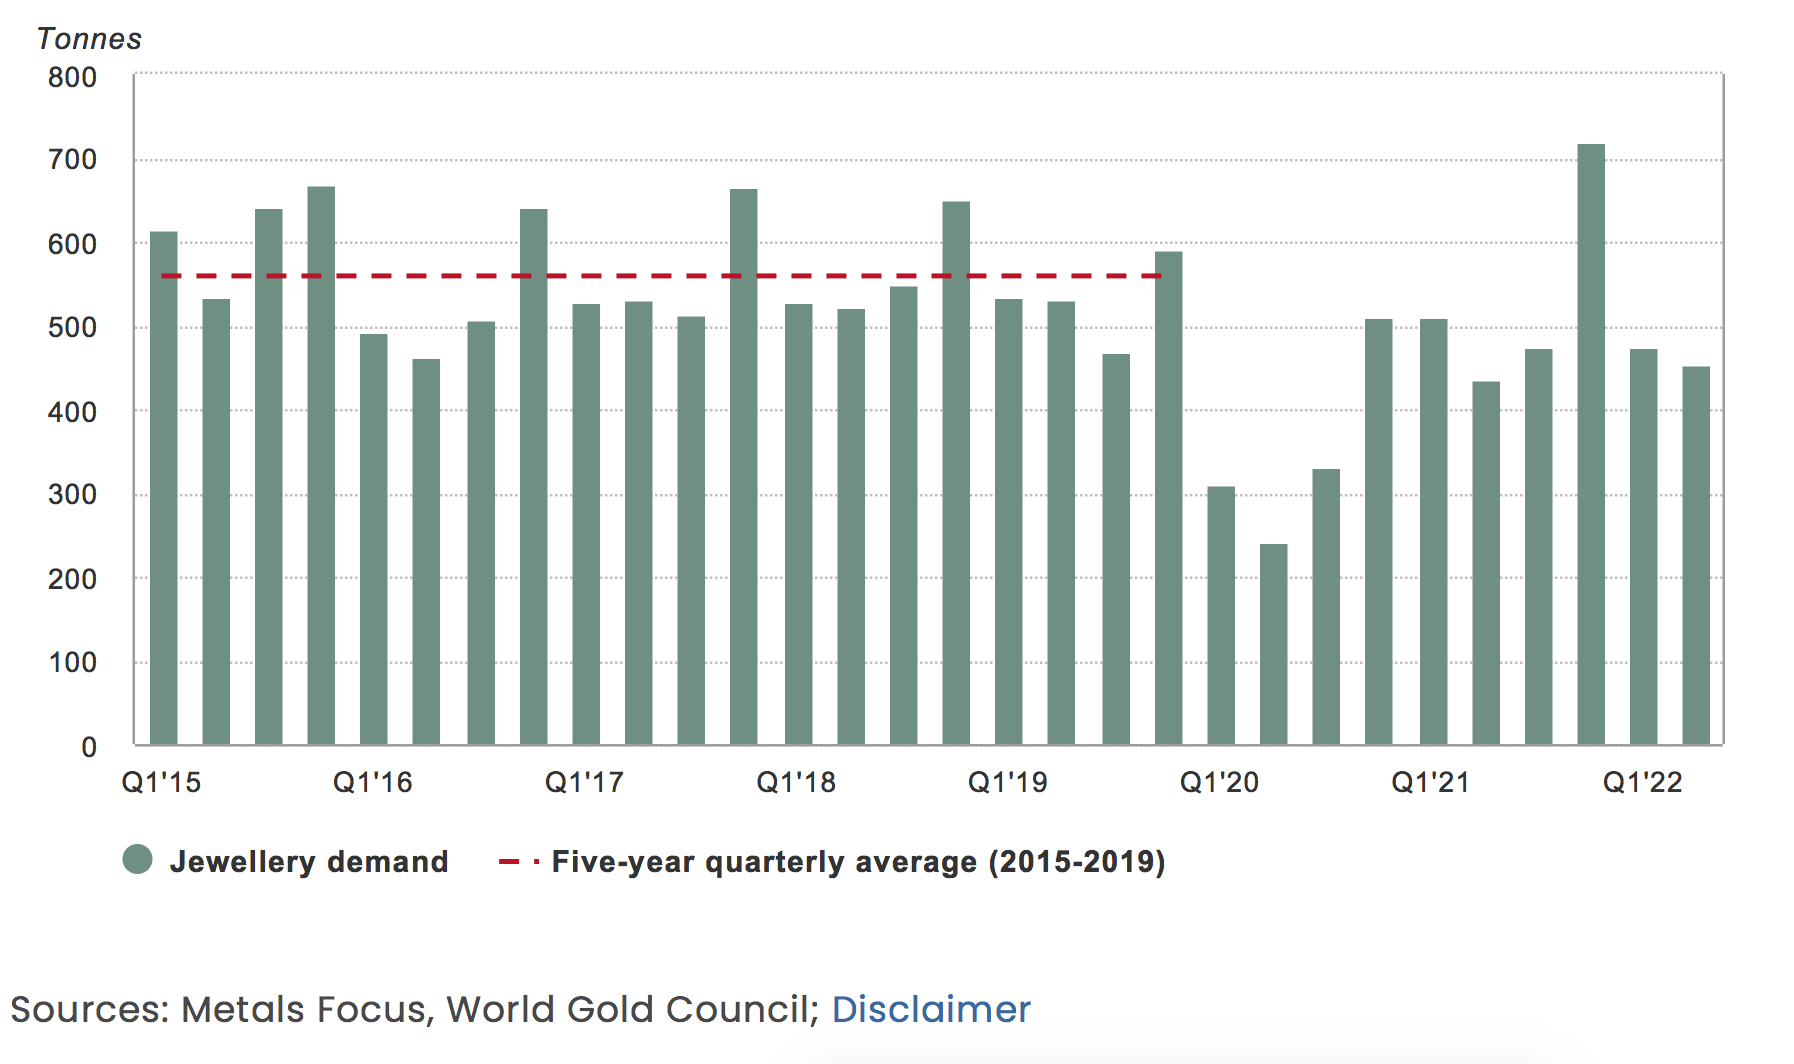
Gold jewelry demand in Q2 was slightly firmer than the second quarter of last year but remains soft compared with pre-pandemic norms. While global jewelry consumption has recovered from the worst of the COVID-induced weakness seen in 2020, it has yet to regain the typical quarterly averages – of around 550t – that characterized the few years preceding the pandemic.
Several factors were at play in constraining demand in Q2, including China’s lockdowns and surging global inflation. But support came from healthy wedding and festival buying in India, and rising oil prices boosting sentiment in the Middle East.
In a repeat of the first quarter, growth in fabrication volumes outstripped that of consumption. Consequently, jewelry inventories increased in Q2 – by 31t – as the supply chain in some markets continued to rebuild stocks after the impact of the pandemic and as it responded to robust consumer demand.
The West
US consumers continued to demonstrate their desire for gold jewelry, although momentum may be slowing. Q2 demand grew 2% to 38t, comfortably above the 33t five-year quarterly average. This took H1 demand to 65t, broadly on a par with H1’21. The return to a more normal year for weddings continued to support demand, but there are early indications that the end of federal income support may have taken the wind out of the more affordable, lower carat end of the market.
European jewelry demand registered the strongest Q2 since 2016 at 15t. The 14% y-o-y increase contributed to a similar (15%) rise in H1 demand to 26t – signaling a return to pre-pandemic levels. Growth was largely due to a rise in the number of weddings, plus a better economic scenario – particularly with regards to lockdowns – than in Q2 last year. However, a reported cooling of demand towards the end of the quarter, as the cost-of-living crisis began to bite, suggests that momentum could slow in H2.
China
China’s gold jewelry demand fell by 29% to 103t in the second quarter. This brought the H1 total to 281t, 17% lower y-o-y and 19% below its 10-year average. Major city lockdowns hampered gold consumption in April and May, with millions subjected to controls to limit contagion. Consumers’ inability to spend, together with decelerating income growth – the 1.5% y-o-y growth in Q2 was the weakest on record excluding 2020 – were main contributors to the weakness in Q2 Chinese gold jewelry demand. Gold jewelry consumption during H1 may have also been dented by a 5% rise in the local gold price as the RMB weakened.
And we believe changing consumer behavior also played a role. The challenging environment encouraged precautionary savings: according to the People’s Bank of China’s quarterly survey, the tendency of local households reached the highest level on record in Q2.1 The fact that the second quarter is a traditional off-season for gold jewelry consumption further exacerbated the weakness.
Heritage gold jewelry continued to dominate in spite of the broader market weakness, although some market saturation caused momentum to slow. 24K pure hard gold lost more market share. The increasing demand for price transparency has weighed on this category, as jewelers continue to transition from “per-piece” to “per-gram” pricing.
The COVID resurgence did not slow the stride of expansion by leading brands in 2022. Chow Tai Fook, for instance, increased the number of points of sale in mainland China from 5,646 at the end of 2021 to 5,931 by end-Q2’22, mainly in lower tier cities.2
Looking ahead, we expect continued weakness in H2 despite potential seasonal q-o-q rebounds. The zero-COVID policy, weak domestic demand and turmoil in the real estate sector may continue to weigh on local economic growth and negatively impact gold jewelry demand. There may be some relief, however, from consumption stimulus measures, while pent-up wedding demand, and expanding product ranges of 24k Hard Gold and Heritage Gold jewelry might provide additional support should the measures to control the pandemic be successful.
India
Robust wedding and festival sales helped boost Q2 jewelry demand to 140t. The 49% y-o-y increase in Q2 demand was largely due to a very weak Q2’21; nevertheless, demand in the most recent quarter was healthy from a longer-term perspective – 6% above the five-year quarterly average of 132t. Demand in H1 reached 234t – 6% higher y-o-y – as the weak first quarter offset Q2 strength.
Sales for Akshaya Tritiya in May, together with wedding purchases during the traditional Q2 wedding season generated the growth in demand. The timely correction in the gold price from the April high also contributed to the positive picture.
But despite healthy Q2 demand, the macroeconomic backdrop of a weaker currency, rising inflation and higher interest rates posed headwinds. Urban Indians have been the main driver of demand growth as economic activity in these areas has largely normalized to pre-pandemic levels. In contrast, rural consumers have been heavily impacted by rising inflation and higher interest rates on agricultural loans, meaning demand from this quarter has yet to recover fully from the impact of COVID.
22k plain gold jewelry continued to dominate the landscape, although more affordable 18k and 14k jewelry gained market share, particularly among younger consumers.
The outlook for the rest of the year is mixed. While festival and wedding demand should be a positive factor in Q4, demand will face challenges from a depreciating rupee, higher inflation and the higher import duty on gold.
Middle East and Turkey
Jewelry demand in the Middle East cemented its return to pre-COVID average levels; in contrast, Turkey remained subdued.
Q2 Turkish gold jewelry consumption fell 9% y-o-y to 7t. Demand has been remarkably steady for the past three quarters but remains weak in a historical context. Currency weakness has contributed to volatility in the local gold price and surging inflation squeezed disposable incomes. Demand for 22k gold with low making charges held up relatively well, as a safe-haven proxy.
Markets across the Middle East mainly witnessed y-o-y growth in Q2. Rising oil prices were supportive of demand across the region, boosting consumer sentiment and income levels. The UAE continued to benefit from a return to near-normal tourist numbers. Iran managed a y-o-y increase in Q2 demand, although this was partially due to the low base from Q2’21. Egypt was an outlier: demand fell 3% y-o-y as depreciation of the local currency translated into a notable increase in local gold prices.
ASEAN markets
After falling in the first quarter, Indonesian jewelry consumption rose in Q2 by 18% y-o-y to 5t. Demand benefited from economic recovery, improving consumer sentiment and rupiah depreciation (some bought gold due to concerns about a further and heavier drop in the currency).
Jewelry consumption in Thailand rose for the sixth consecutive quarter, increasing by 10% to 2t. While demand has shown consistent growth since the start of 2021, it remains well below pre-pandemic levels. Jewelry consumption has been supported by the economic recovery, emergence from COVID and a rebound in tourism. Concerns about inflation and the purchasing power of the baht have also driven interest in gold as a store of value.
Jewelry fabrication outperformed consumption as gold shop owners started to re-stock in light of continued consumption growth.
Jewelry consumption in Vietnam rose for the second quarter by 28% y-o-y to 4t. Demand was supported by falling local gold prices, the economic recovery, and higher incomes, as many companies reversed temporary salary cuts. The government’s US$15bn stimulus package has boosted GDP growth and consumer sentiment. It should be noted that the second quarter is traditionally relatively slow for jewelry sales due to the impact of Vietnamese New Year, which falls in Q1.
Jewelry demand in Singapore rose 43% y-o-y to 2t. The economic recovery and the lifting of most remaining COVID measures has supported demand.
Jewelry consumption in Malaysia increased 35% y-o-y to 3t. With pandemic control measures entirely lifted and international travel resuming in April, as well as a lower base last year due to Malaysia’s Moving Control Orders, jewelry consumption saw a notable rebound. Festival buying also played a role in the second quarter.
Rest of Asia
Japanese gold jewelry consumption saw a second consecutive quarter of 5% y-o-y growth. Demand remains modest at 4t but in light of the rising local gold price the Q2 growth was noteworthy. Rising inflation is a potential headwind for the remainder of the year, however.
South Korea saw an 8% y-o-y decline in Q2 jewelry demand to 4t. The uncertain domestic economic environment, at a time of relatively high local gold prices, contributed to the more cautious consumer sentiment.
Australia
Australian jewelry demand rose 8% y-o-y to 3t. The higher cost of living is weighing on demand; although consumption is up, the growth in jewelry demand is slowing.
Source: World Gold Council